Save the River Action
by: John Peach
I am asked many times in a week at gatherings and in social settings about the causes of this summer’s high waters. I have taken to carrying this Plan 2014 Update from Save The River, which includes three charts, because they do a good job of illustrating the causes of the high water:
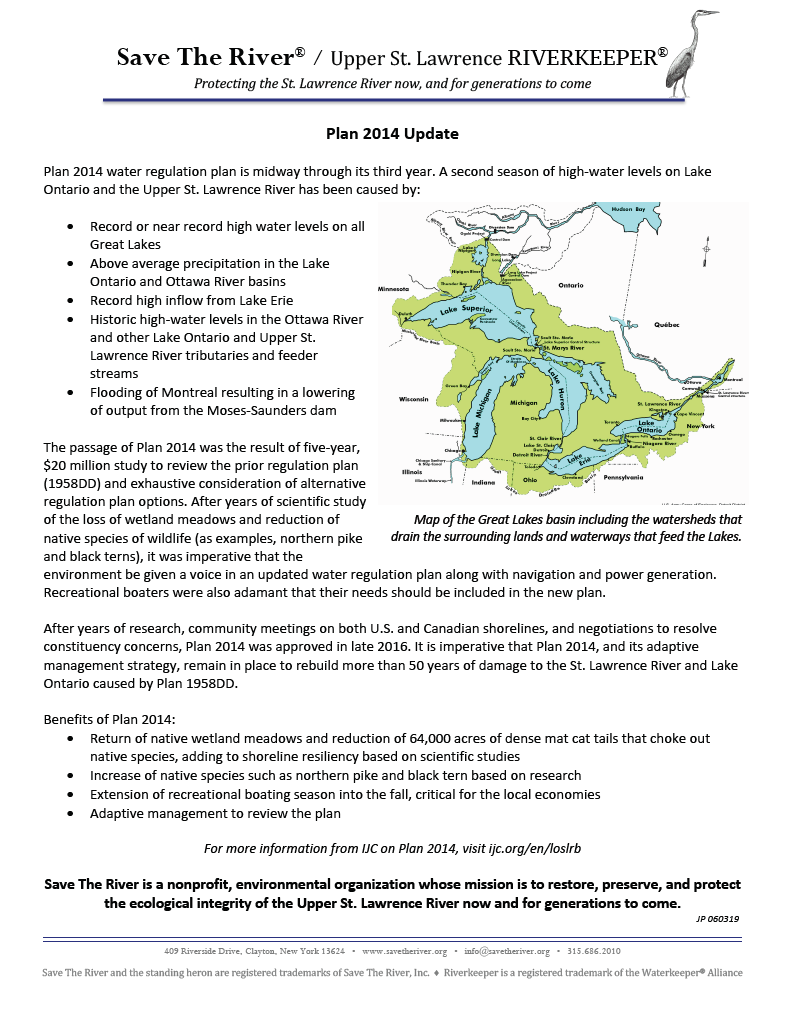
[Update synopsis for small screens]
Plan 2014 water regulation plan is midway through its third year. A second season of high-water levels on Lake Ontario and the Upper St. Lawrence River has been:
• Record or near record high water levels on all Great Lakes
• Above average precipitation in the Lake Ontario and Ottawa River basins
• Record high inflow from Lake Erie
• Historic high-water levels in the Ottawa River and other Lake Ontario and Upper St. Lawrence River tributaries and feeder streams
• Flooding of Montreal resulting in a lowering of output from the Moses-Saunders Dam
The passage of Plan 2014 was the result of a five-year, $20 million study to review the prior regulation plan (1958DD) and exhaustive consideration of alternative regulation plan options. After years of scientific study of the loss of wetland meadows and reduction of native species of wildlife (as examples, northern pike and black terns), it was imperative that the environment be given a voice in an updated water regulation, plan along with navigation and power generation. Recreational boaters were also adamant that their needs should be included in the new plan. [Read more]
Chart #1
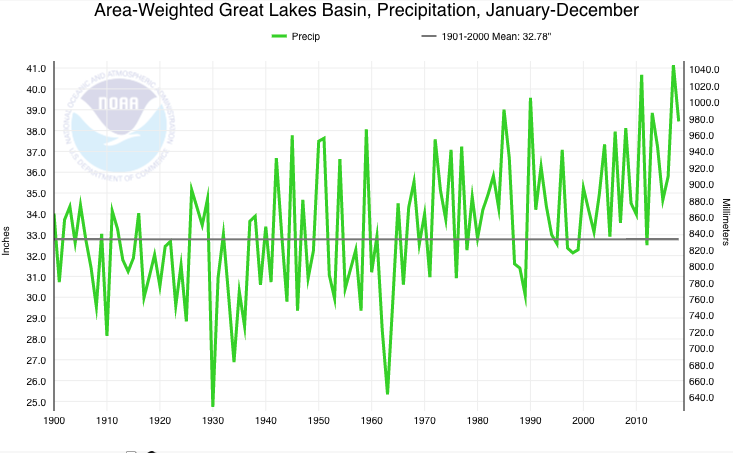
Chart #1 illustrates the increasing precipitation trend going back to the early 1900’s, which culminated in record rainfall this spring. A footnote to this chart is that the Ottawa River Basin is 2½ times the area of the Lake Ontario Basin. When the spring rains are heavy over the Lake and River, and the storms move northeastward, there’s going to be flooding downriver in Montreal, as the Ottawa River is generally in freshet caused by snow and ice melt and precipitation. When Montreal floods, the International Joint Commission’s (IJC) International Lake Ontario St. Lawrence River Board has to slow the outflow through the Moses-Saunders Dam, to keep from exacerbating the flooding.
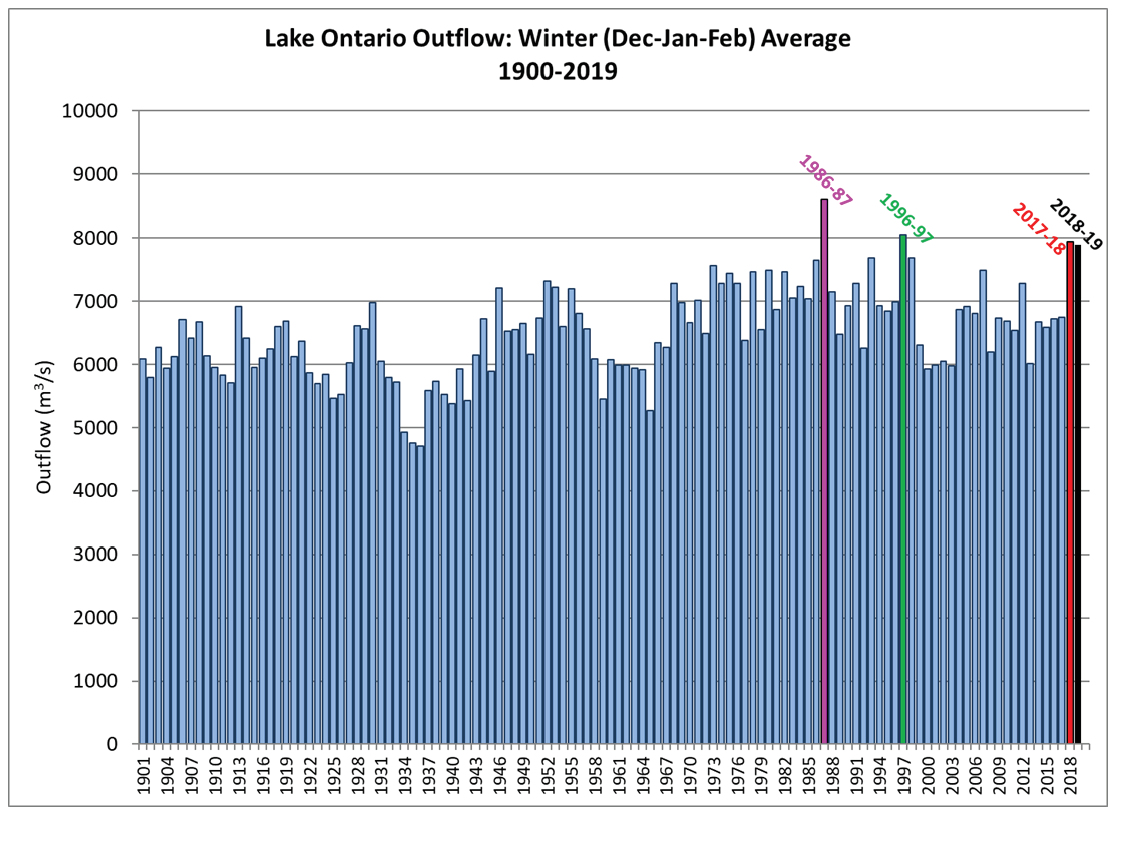
Chart #2 shows the Lake Ontario Outflow for Winter’s from 1900-2019. Contrary to popular Riverside opinion that “they didn’t let any water out last winter,” the fourth highest historic rate of outflow was being let out of the system last winter!
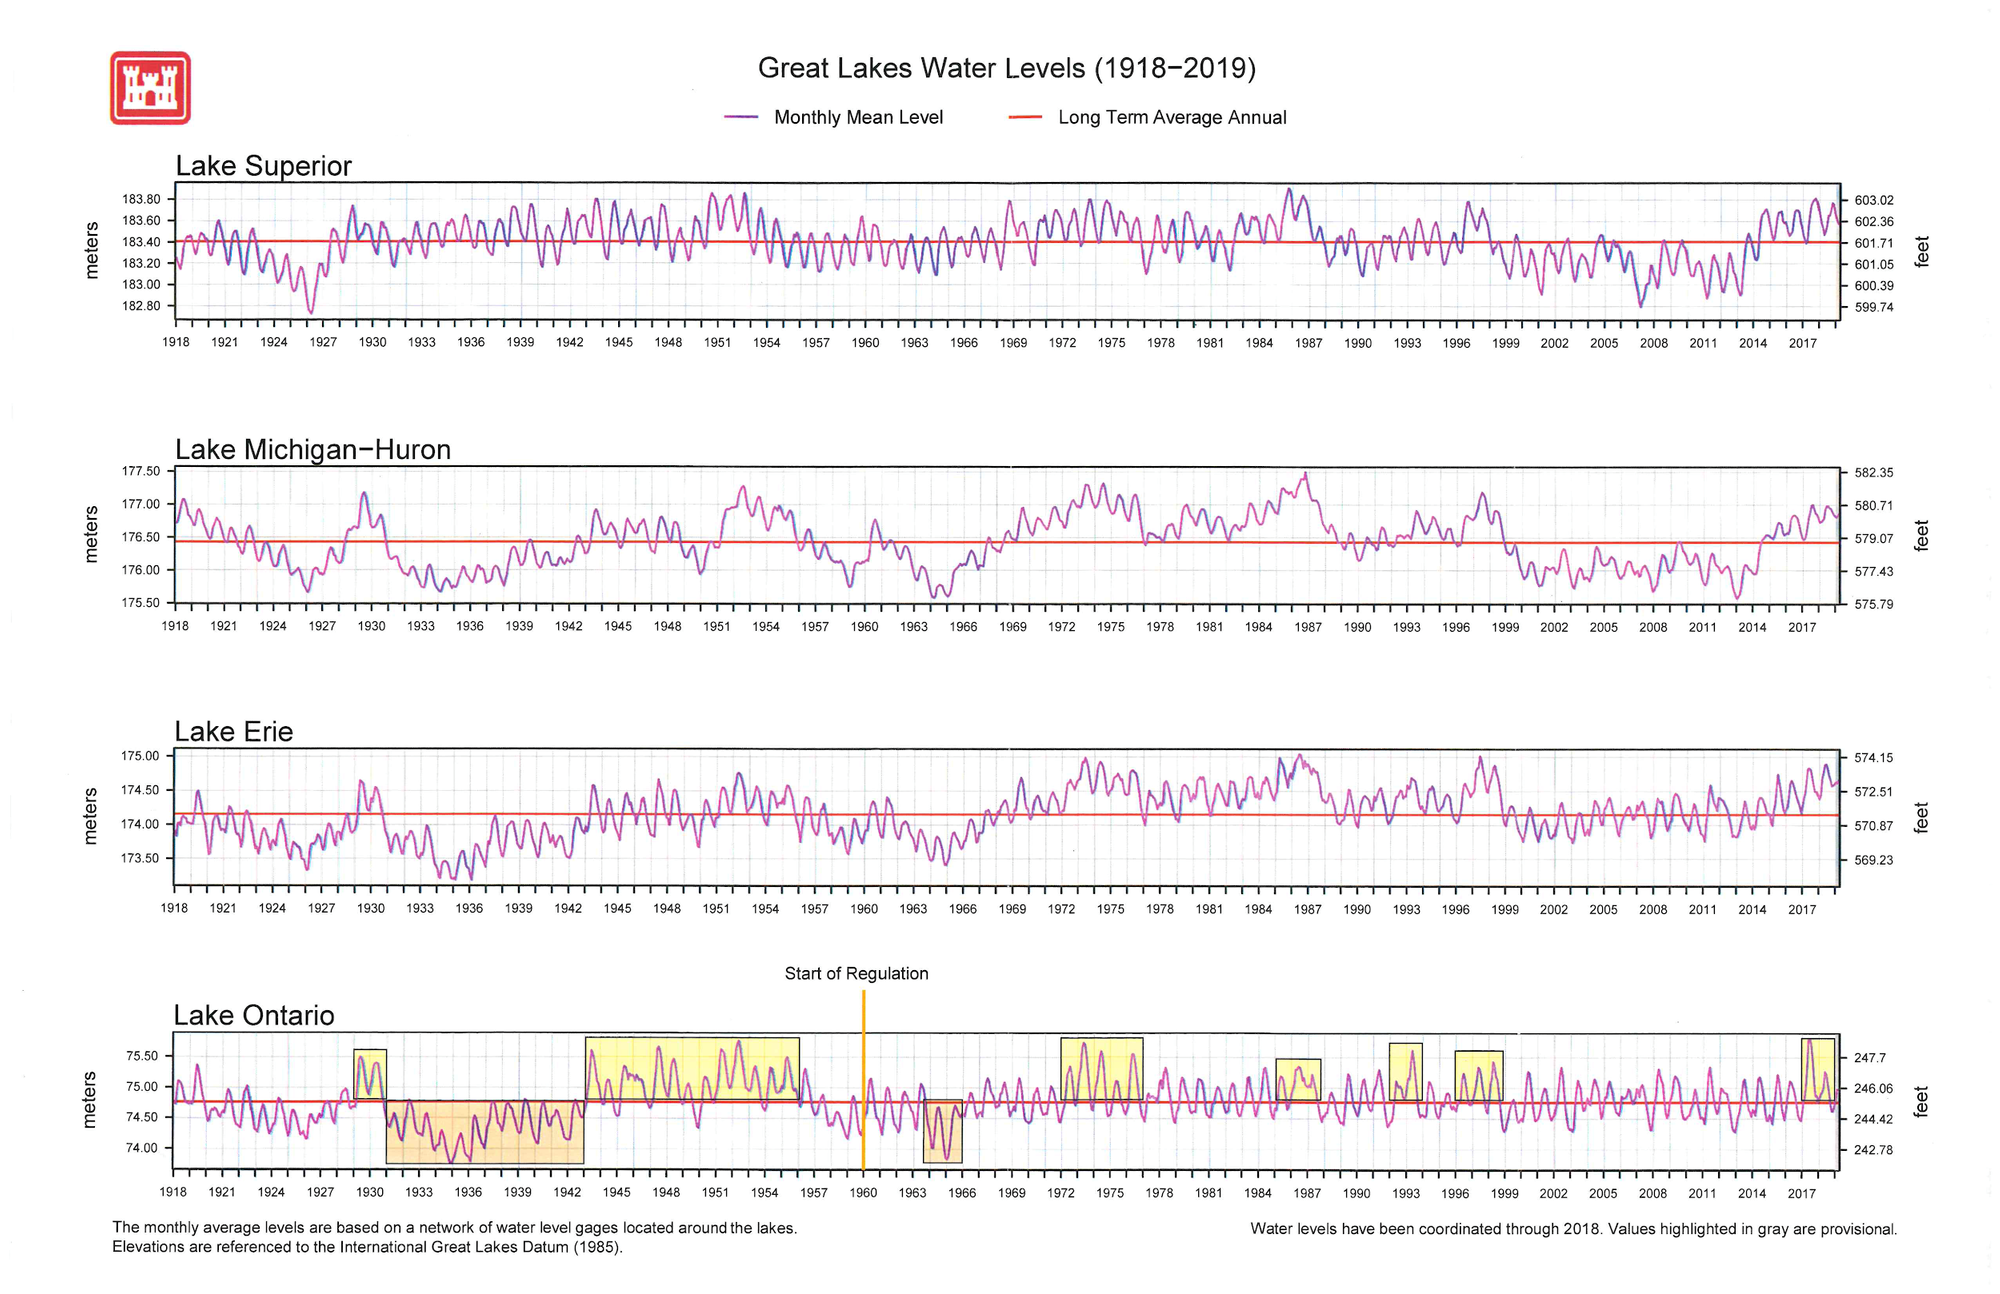
Chart #3 from the US Army Corps of Engineers shows the correlation among the level of the other four Great lakes and Lake Ontario. There are no dams in the whole system except the Moses-Saunders Dam. What Mother Nature sends over Niagara Falls is going to flow down the St. Lawrence River. There would not be a significant difference in water levels, between any water levels plans, when we are dealing with such large volumes of water.
Save The River has recently sent letters to the IJC and the Seaway (see attached).
The first letter urges the IJC to begin its adaptive management review process sooner rather than later, take action on running a comparison between Plan 2014 and Plan 1958DD, and demand that the Seaway begin a patterning program to allow shipping to be halted for several days at a time to increase the outflow. Patterning is a program of several days of no shipping followed by several days allowing shipping. See IJC letter here
The second letter to the Seaway administrators urges the Seaway to begin the patterning program immediately. [See letter to Seaway here.]
Save The River will continue to defend the environmental benefits of Plan 2014 while participating in and waiting for the results of the adaptive management review process.
Let‘s all hope for dry and warm weather to help the process of lowering water levels.
John Peach, Executive Director, Save the River, Clayton NY.

